

US PPI Report for June Confirms Disinflationary Trend in Yesterday's CPI Report
Economic news and commentary for July 13, 2023

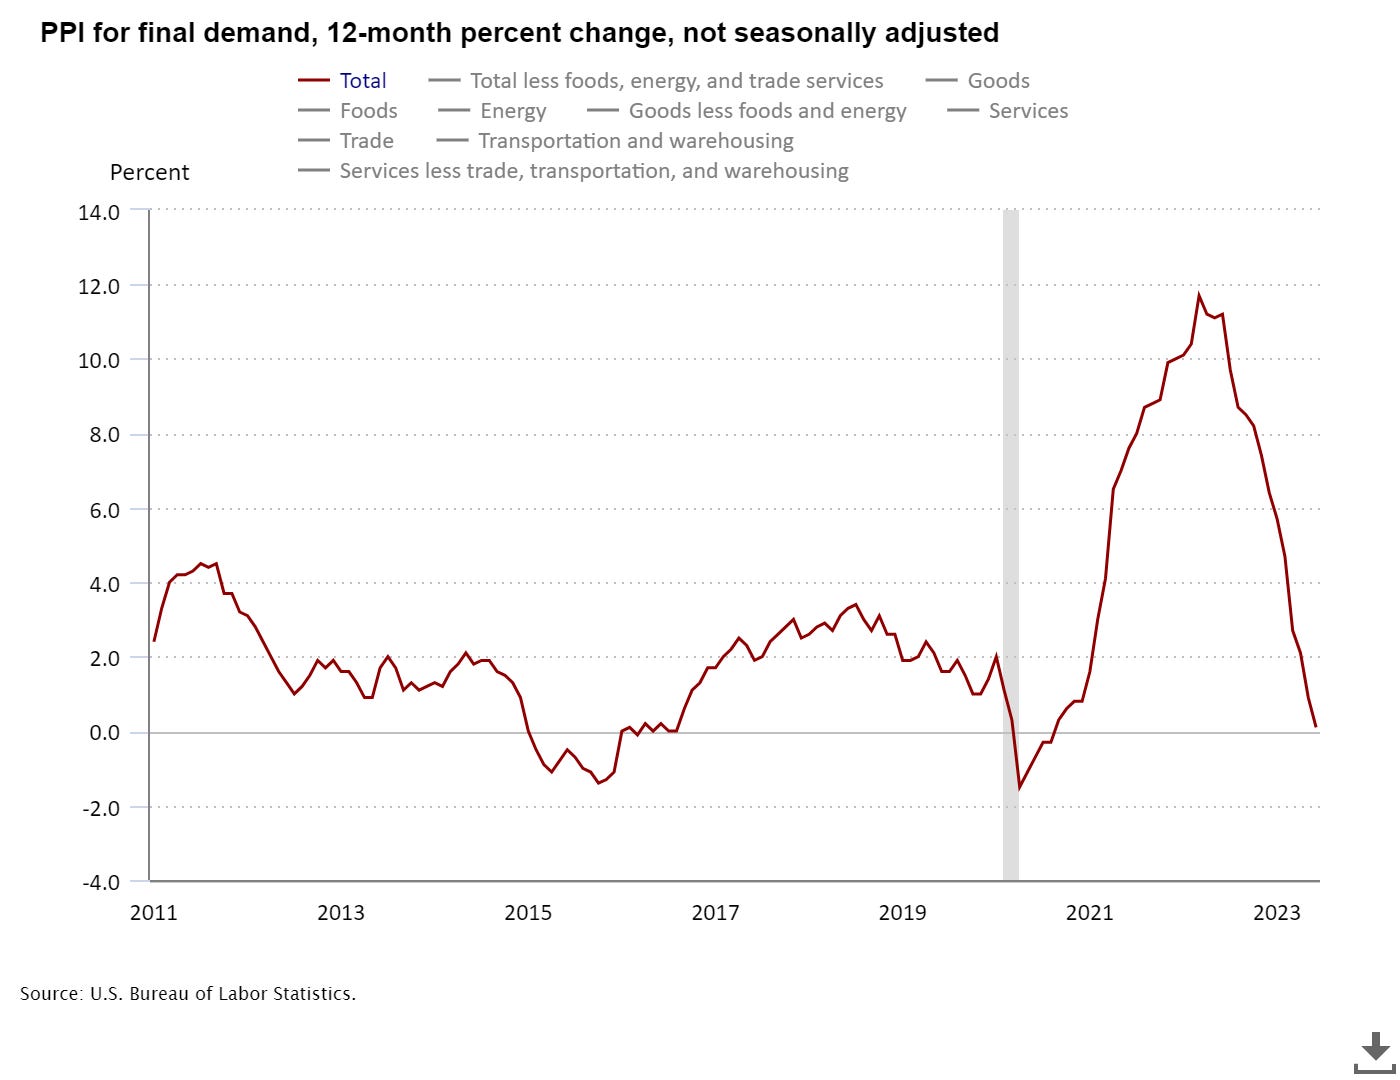
US PPI
The latest data on the US PPI reveals a continuation of the disinflation trend, with both month-over-month (MoM) and year-over-year (YoY) growth rates experiencing a slowdown. In June, the PPI grew by a modest 0.1% MoM and 0.1% YoY, a significant decline from the 0.9% YoY growth seen in May. The annual growth of the PPI is now at its lowest point since August 2020, and it should be expected to turn negative in the coming months. Core PPI, which excludes volatile components, displayed stronger growth at 2.6% YoY, but its monthly pace matched the overall headline gain of 0.1% MoM.
The decline in producer prices can be attributed to a broad-based decrease in goods prices. The core goods PPI experienced a notable decline of -0.2% MoM. This marks the first drop since the beginning of the pandemic. Moreover, the indexes measuring input goods witnessed even steeper declines, with processed goods down -0.6% MoM and -9.4% YoY, and unprocessed goods down -2.1% YoY and -32.2% YoY. The YoY growth rate of unprocessed goods PPI, which stands at -32.2% YoY, has now fallen below pre-pandemic levels and the lows observed in the 2010s. This decline is in line with the easing of commodity prices from the peak levels reached during the recent supply chain crises. Additionally, the decline in processed goods PPI (-9.4% YoY) represents the weakest figure since September 2009. Given the significant deflationary pressures on goods prices, it comes as no surprise that we are witnessing declines in goods prices in the CPI report as well. The weak performance of goods PPI is expected to prevent any significant flare-ups in goods CPI in the near future.
Service producer prices, on the other hand, have remained relatively stable, hovering in the 4% range for the fourth consecutive month at 4.4% YoY, up from 4.1% YY. Service prices were flat on a monthly basis, so the advance in the annual growth of services PPI is mainly attributed to base effects, as June 2022 witnessed a decline of -0.3% MoM. The stronger gains observed in the second half of 2022 suggest that services PPI may ease in the latter part of 2023. The details of the services PPI show deflation in key areas. Prices for truck transportation of freight, for instance, fell by -2.1% MoM. Other sectors that witnessed price declines include business loans (partial), food and alcohol wholesaling, gross rents for office buildings, and staffing services.
Today's PPI data provides further evidence of the ongoing disinflation trend, which is likely to continue in future CPI reports. Excluding the significant increase seen in April (+0.7% MoM), the average monthly pace of services PPI gains has remained flat. If this trend persists, it could provide the Federal Reserve with a strong signal to pause rate hikes.
Still to come…
10:30 am (EST) - US EIA Natural Gas Report
4:30 pm - US Fed Balance Sheet
Morning Reading List
Other Data Releases Today
UK GDP fell -0.1% MoM in May after a slight growth of 0.2% MoM in April. GDP has been stagnant in the 3 months to May. Production fell by -0.6% MoM while the services sector was flat on the month. The construction sector also fell, -0.2% MoM.
Monthly manufacturing output in the UK decreased by -0.2% MoM in May and saw 8/13 sub-sectors negatively contributing to growth. Production output for the 3-months to May rose 0.4% vs the prev 3-months; growth came from manufacturing (0.8%).
The UK trade balance fell -£3.5 bil to -£19.8 bil in May with exports down -4.4% MoM and imports up 4.2% MoM. Exports to the EU continue to decline, down -6.8% MoM, and non-EU imports jumped 5.9% MoM.
French inflation was confirmed at 0.2% MoM and 4.5% YoY (down from 5.1% YoY). Core inflation was still relatively high at 5.7% YoY. Services inflation was upgraded 0.1 ppts to 3.0% YoY, and goods inflation was downgraded -0.1 ppts to 4.2% YoY.
Euro area industrial production improved 0.2% MoM in May but is still down -2.2% YoY. Capital goods production grew 1.0% MoM with smaller gains of 0.5% MoM in intermediate and durables production and 0.3% MoM in non-durables.
The ECB’s June meeting minutes showed that members saw a "worsened inflation outlook" and that they wanted to send a "strong signal". Some wanted a 50 bps hike. The ECB remains in data-dependent mode but thinks that more hiking is likely needed.
US CPI
June CPI: More Convincing Progress Underway (Wells Fargo) - Today's report on the Consumer Price Index for June brought good news. Headline consumer price inflation increased 0.2% over the month and 3.0% over the past year. For the latter, this was the lowest reading since March 2021. Excluding food and energy prices, the core CPI increased 0.2% (rounded up from 0.16%) over the month, the smallest monthly increase in core inflation since February 2021.
Inflation continues to ease in June, but remains too hot for FOMC (TD Bank) - The Consumer Price Index (CPI) rose 0.2% month-on-month (m/m) in June, a tick below expectations. On a 12-month basis, CPI slipped to 3.0% – its slowest pace since March 2021 – and well off its peak of nearly 9% last June.
Good news on US inflation won’t prevent a July rate hike (ING) - US inflation pressures are showing broader signs of moderation with both headline and core rates undershooting expectations. Nonetheless, the Federal Reserve seems intent on pushing ahead with a July rate hike, but the need for additional tightening thereafter is questionable.
US CPI: a cooler start to the summer (CIBC) - The pace of annual headline inflation could accelerate temporarily in the next couple of months as base effects become unfavorable, but the more important core group should continue to see inflation melt away. Although the Fed will clearly view the progress in the core services ex. rent of shelter group favorably, the ongoing strength in the labor market likely has them doubting the sustainability of that deceleration, so we continue to expect two further quarter point hikes ahead.
U.S. Inflation Outlook: A Meaningful Shift in the Second Half of 2023 (PIMCO) - After stubborn U.S. inflation in the first half of 2023 kept the Federal Reserve raising rates, June’s softer inflation report suggests July may mark the end of the hiking cycle.
CPI Eases Further as Housing Inflation Slows (NAHB) - Consumer prices in June saw a continued deceleration, with the smallest year-over-year gain since March 2021. Over the past twelve months, inflation has been consistently decelerating. Despite a slowdown compared to the previous month, the shelter index (housing inflation) continued to be the largest contributor to both headline and core inflation, accounting for over 70% of the increase in headline inflation.
U.S. Consumer Price Index (June) — Supercore is Super Good (BMO) - This was a much better than expected CPI report. It showed that the Fed’s tightening efforts continue to exert disinflation pressure. And, perhaps for the first time in this rate-hike campaign, the light of price stability is starting to shine more brightly at the end of the tunnel. This is the prerequisite for an eventual, lengthy, Fed policy pause.
Rapid disinflation, but free lunch is over (EY Parthenon) - The focus will now turn to sequential momentum for core services prices. Indeed, the “free disinflationary lunch” from rapidly falling energy prices, cooling food price inflation and easing core goods inflation is now over and any additional disinflationary momentum will have to come from slower month-over-month (m/m) gains in core services prices.
The Consumer Price Index (CPI) Rose 0.2% in June (First Trust Portfolios) - There was more progress in the battle against inflation in June, but don’t expect that to change the likelihood of a Fed rate hike later this month. Consumer prices rose 0.2% in June, coming in below the consensus expected 0.3%, and pushing the twelve-month change down to 3.0%. On the surface level it looks like inflation has been moderating rapidly recently, with year-to-year inflation dropping from 4.9% to 3.0% in the last two months.
Bank of Canada Announcement
Bank of Canada hikes again as inflation fears linger (ING) - The BoC hiked rates to 5% as broadly expected with the tone of the statement suggesting we will need to see significant softening in activity and inflation to deter it from hiking again in September. Markets are pricing a 75% chance of a move and that looks about right. USD/CAD could now break below 1.3000 quite soon.
Bank of Canada takes their policy rate 25 bps higher (TD Bank) - Today's rate hike demonstrates that the Bank of Canada is not satisfied with the modest cooling in inflation and wage pressures that has been seen since its June hike. As it outlined in the statement, it's concerned about excess demand and core inflation that are proving to be more persistent than what policymakers had expected.
Bank of Canada: Even more to come? (CIBC) - The Bank of Canada delivered the 25bp hike that was widely expected today, taking the overnight rate up to 5.0%, in light of evidence that excess demand and core inflation are proving "more persistent" than expected and a revised forecast that suggests inflation will take longer to return to its 2% target.
BoC: High Five (BMO) - Today's move can be characterized as a moderately hawkish hike, in that the BoC is certainly not closing the door on the possibility of further moves. The Bank remains above consensus on their growth call, and frankly they have been mostly right on that view this year. But, in conjunction with the surprising resiliency of the economy, the Bank is also still quite concerned about persistent underlying inflation.
US
Beige Book — Economic Activity Up Slightly (BMO) - The Fed’s regional report card, prepared for the July 25-26 meeting, suggests that the economy is still managing to walk the soft-landing tightrope. Earlier this morning, a better-than-expected June CPI report showed inflation cooled meaningfully, providing some relief that the end to the Fed’s aggressive rate hike campaign is likely near. However, core metrics are still elevated, keeping a July rate hike on the table.
A Guide to State-Level Estimates of Labor Force Participation Rates (Cleveland Fed) - Changes in the US labor force participation rates (LFPRs) have brought attention to state-level estimates. This brief discusses state-level estimates of the LFPR and what they can—and cannot—tell us about recent LFPR trends in our region.
Will a Cooler Labor Market Slow Supercore Inflation? (San Francisco Fed) - Inflation has declined substantially since its peak in June 2022. This largely reflects lower energy prices and more moderate price increases for core goods, as global supply chain constraints have eased and consumers have resumed more normal spending patterns, shifting back from goods toward services. In contrast, inflation for core services continues to rise, in part due to lingering pandemic-related increases in shelter prices that are still affecting official inflation statistics (Lansing, Oliveira, and Shapiro 2022).
Asia
Tomato prices shift inflation higher in India (ING) - An increase in seasonal food (tomato) prices has pushed headline inflation higher again, but it remains well within the Reserve Bank of India's target range and is no threat to higher rates.
Bank of Korea’s hawkish pause extended on slowing inflation (ING) - As widely expected, the Bank of Korea decided to leave its policy rate at 3.50%. However, the BoK maintained its hawkish stance, seeing the risk of inflation reaccelerating to the 3% range over the coming months.
Real Estate
Mortgage Activity Increases Despite Rates Topping 7% (NAHB) - Per the Mortgage Bankers Association’s (MBA) survey through the week ending July 7th, total mortgage activity increased 0.9% from the previous week and the average 30-year fixed-rate mortgage (FRM) rate rose 22 basis points to 7.07%. The FRM rate has risen 30 basis points over the past month and topped 7% for the first time since November of 2022.
Commodities
Higher for Longer Hits Commodities (BMO) - Growing expectations of higher-for-longer policy rates and concerns over China’s tepid post-pandemic recovery are likely to continue to weigh on many commodities in the second half of the year. Encouragingly for central banks, a number of key agricultural prices, notably wheat, corn and soybeans, have lost ground this year, which has helped take some steam out of consumer price inflation.
Crypto
Runs on Stablecoins (Liberty Street Economics, NY Fed) - Stablecoins are digital assets whose value is pegged to that of fiat currencies, usually the U.S. dollar, with a typical exchange rate of one dollar per unit. Their market capitalization has grown exponentially over the last couple of years, from $5 billion in 2019 to around $180 billion in 2022. Notwithstanding their name, however, stablecoins can be very unstable: between May 1 and May 16, 2022, there was a run on stablecoins, with their circulation decreasing by 15.58 billion and their market capitalization dropping by $25.63 billion (see charts below.) In this post, we describe the different types of stablecoins and how they keep their peg, compare them with money market funds—a similar but much older and more regulated financial product, and discuss the stablecoin run of May 2022.
Subscribe to receive Econ Mornings every weekday at 9 am. More economic and finance content on Twitter, Reddit, and my website.